Statistical Concepts and Metrics of Algorithm Bias and Fairness

- Log in to post comments
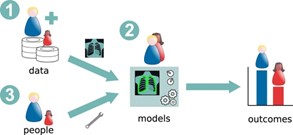
In the first entry of this series, we examined how algorithms can be biased on a variety of factors, including their underlying data, biased individuals creating models, or from statistical mischaracterizations from models themselves. Ricci Lara et al, 2022 illustrated this in their figure sited below (Ricci Lara et al., 2022).
From: Addressing fairness in artificial intelligence for medical imaging
In this entry, we’ll explore how bias in algorithms is identified and quantified according to a few different statistical concepts and metrics.
When identifying and quantifying algorithm bias, it tends to be examined through the lens of fairness. A perk of this perspective is that it forces the examination to answer the question, “Fairness for whom?”. In this pursuit, the fairness is often being investigated from the perspective of an individual or a group (race, gender, disease, etc.). We’re separating these perspectives for the purpose of explanation, however these concepts can and should be used in tandem to gauge bias/fairness from many angles. To aid this explanation, we’ll use the VHA Care Assessment Needs (CAN) Mortality Score we discussed in the initial entry as an example to illustrate what these concepts look like in practice.
Fairness from the perspective of the group may not guarantee that all individuals in that group are fairly represented. Individual Fairness, as defined by Dwork et al., (2011) necessitates that individuals with comparable attributes or circumstances receive similar evaluations from the algorithm. This approach is pivotal in settings where data might not be categorized into clear group divisions, offering a nuanced perspective on fairness (Zhang et al., 2023). When applied to the VHA CAN Mortality Score, Individual Fairness would demand that veterans with similar health and socioeconomic backgrounds receive similar risk assessments, regardless of racial or ethnic classifications.
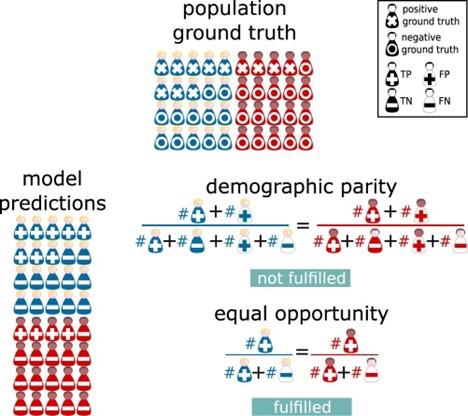
Individual fairness allows you to granularly ensure model fairness but may not give clear insight as to how different real-world groupings (race, gender, disease, etc.) could be systemically disadvantaged by the model. A big driver of algorithmic group unfairness is data that is differentially complete for different groups. Demographic Parity is a concept to address fairness on a group level. It confronts the ethical challenges that arise when biased data are employed to predict outcomes, potentially persisting existing disparities. Kusner et al., (2018) emphasize that achieving this involves a careful balancing act of incorporating minority group data into the model development, aiming to reflect a future where all groups' outcomes are equitable. However, this approach ultimately still relies on predictions rather than observed values which can be problematic (Alikhademi et al., 2022). The CAN Score would meet demographic parity if the distribution of mortality score predictions were similar for Black and White Veterans.
Another group fairness concept is Equality of Opportunity. This concept addresses the concern of relying on biased predictions to mitigate fairness by using historical data to ensure that the likelihood of encountering the outcome of interest is equal among those included in the prediction (Hardt et al., 2016). Equalized Odds is another, more suitable version of this for models with more than two outcomes. This concept ensures that each group has equal rates of people mischaracterized by the model using historical data. This mischaracterization is investigated by looking at false-negative rates and false positive rates (Hardt et al., 2016). A false negative rate (FNR) is a calculation that tells you how many people that are positive for the outcome of interest were classified as negative. A false positive rate (FPR) is a calculation that tells you how many people who were negative for the outcome of interest were classified as positive. So, equalized odds would be satisfied for the CAN Score if the FNRs and/or FPRs of the mortality score for the different comparison groups of interest are similar.
It should also be noted that scholars have called for comparison groups to also have the same chance of being misclassified to satisfy equalized odds (Hedden, 2021). This additional qualification step is meant to avoid further disadvantaging marginalized groups. To this end, violation of this double criterion has been noted to suggest the use of the algorithm to make the prediction of interest is biased rather than the algorithm itself being biased (Grant, 2023). If the CAN Score as similar FNRs/FPRs, but one group had a significantly less likely chance of being misclassified, then it may be biased to use the CAN score to gauge mortality for that group. This would be biased for not meeting the equalized chance of mischaracterization “rule” of equalized odds. FNRs/FPRs are completely dependent on the risk distribution within groupings made by model developers which inherently introduces differential relationships with risk trends. This fails to hold a set standard for all people regardless of their grouping (Corbett-Davies et al., 2017).
Both individual and group fairness concepts have their limitations. The relevance of these different concepts is totally dependent on the algorithm’s components and plans for implementation. Using multiple concepts of algorithm bias/fairness should be used when developing models to gauge performance of the model from different perspectives. The intended practical use of the algorithm and the practical limitations of the data are ultimately what dictates how useful any concept or metric to gauge bias can be. I’ll leave you with this illustration of a lot of the concepts that are discussed in this blog entry from Ricci Lara et al., 2022 followed by more examples.
From: Addressing fairness in artificial intelligence for medical imaging
Statistical Concept Examples
Example Context
Imagine a healthcare system using the CAN Mortality Score to predict the 1-year mortality risk of veterans. The model categorizes veterans as 'High Risk' or 'Low Risk' based on their health data, socioeconomic factors, and previous medical history.
False Negative Rate (FNR)
Definition: The proportion of individuals who actually have a high mortality risk (positive for the outcome) but are incorrectly predicted by the model as low risk (negative prediction).
Simple Example:
- Imagine 100 veterans truly have a high risk of mortality within the year.
- The CAN score, however, only identifies 70 of them as high risk, missing 30.
- The FNR would be 30/100 = 30%.
- This means 30% of the high-risk veterans were not identified by the model, potentially missing out on crucial interventions or monitoring.
False Positive Rate (FPR)
Definition: The proportion of individuals who actually have a low mortality risk (negative for the outcome) but are incorrectly predicted by the model as high risk (positive prediction).
Simple Example:
- Suppose there are 200 veterans who actually have a low risk of mortality within the year.
- The CAN score incorrectly identifies 40 of them as high risk.
- The FPR would be 40/200 = 20%.
- This means 20% of the low-risk veterans are incorrectly flagged as high risk, possibly leading to unnecessary stress or treatments.
Risk Distribution
Definition: The distribution of predicted risks among different groups, which can reveal biases if certain groups are consistently assigned higher or lower risk scores than others.
Simple Example:
- Imagine the healthcare system serves two groups of veterans: Group A and Group B.
- The CAN score predicts 60% of Group A as high risk and 30% of Group B as high risk.
- This uneven distribution suggests the model might be biased, either overestimating the risk for Group A or underestimating it for Group B.
- It’s essential to investigate why this disparity exists, as it could be due to factors like unrepresentative training data or overlooked variables that differently affect each group’s health outcomes.
By examining FNR, FPR, and risk distribution, healthcare providers can better understand the model's performance and its implications on different groups, ensuring that the mortality predictions aid in fair and effective patient care.